FAIR can be extended
to the analysis of risk scenarios that have multiple impact variables, such as
in public safety. This note reports
lessons learned from a simple model inspired by the Amtrak crash.
Introduction
The crash of an Amtrak passenger train in Philadelphia
(5/13/15), which killed 8 and injured over 200, offers an opportunity to
analyze the risk of such situations and consider the investment case for
positive train control. According to NTS
Board member Robert Sumwalt PTC “would have prevented the accident if it was
operational.”
Despite “information” in its name, FAIR is a useful and
appropriate tool for analyzing many kinds of risk other than information risk. Let us take this opportunity to apply it to
transportation safety.
FAIR has a big drawback, at least as it is typically
used. The result of a FAIR analysis is
an estimate of annual loss expectancy (ALE), which is presumed to be measurable
on one dimension, inevitably money. But
when matters of public safety are involved, as with transportation and health
care, money is only one consideration.
Loss of life, injury, and long-term impairment of quality of life (which
together I call life safety) are outcomes that cannot be adequately expressed
in money terms, for reasons emotional, philosophical, and political. Therefore any risk analysis of a
transportation or health care scenario must include life safety in addition to
financial loss.
One way to assess risk in such a multidimensional outcome
scenario is to do a FAIR analysis of each outcome variable separately. The deliverables to the decision maker is
then (1) the ALE for financial loss (2) the ALE for life safety loss and (3)
some depiction of how the two ALEs correlate.
It is then up to the decision maker to process these analytical results
and set priorities for investment, just as in the case of a purely financial
impact the decision maker must decide which of two ALEs is preferable, or
whether the investment needed to move from one ALE to another is
justified.
In this note I report on the experience of such a modeling
effort, inspired by the Amtrak accident.
I find some interesting and useful insights from using FAIR in this way.
Model Structure
I constructed two simple and nearly parallel FAIR risk
analyses of a passenger train risk scenario similar to the May 13 2015 Amtrak
crash in Philadelphia. The main goal of
the analysis was to test the ability of the FAIR ontology to support the
analysis of a risk scenario having two important impact variables, financial
loss and life safety. This goal makes
little demand for representational accuracy of the actual train crash scenario,
so the model is simple. Each impact
variable, financial loss (ALE) and life safety loss (expressed as ALE of lives
lost), was analyzed using the FAIR ontology.
The two analyses are nearly independent, having only the threat event
frequency and the probability distribution of lives lost as a common driver,
and in that sense are “nearly parallel.”
The model structure is shown in the following figure. Lives lost drives fines and judgments as well
as being a thing of value in its own right.

Figure 1. Structure
of a FAIR Model with Two Impact Variables.
I used what I considered to be plausible values for
parameters of the probability distributions, all of which were of the PERT family. I do not believe the main lessons of the
analysis depend in any meaningful way on the values of the parameters, so I
omit discussion of the choices of parameter values. Likewise the model could easily be built out
in considerably more detail without materially changing the results. Monte Carlo simulation with 1,000 trials was
used to model the effect of the several random variables.
Results
The next two figures show the simulation results for the
probability distributions of annual loss expectancies for financial loss and
life safety (i.e., lives lost). (Note
that financial loss is measured in $K, so the abscissa for financial ALE is
actually $M.)
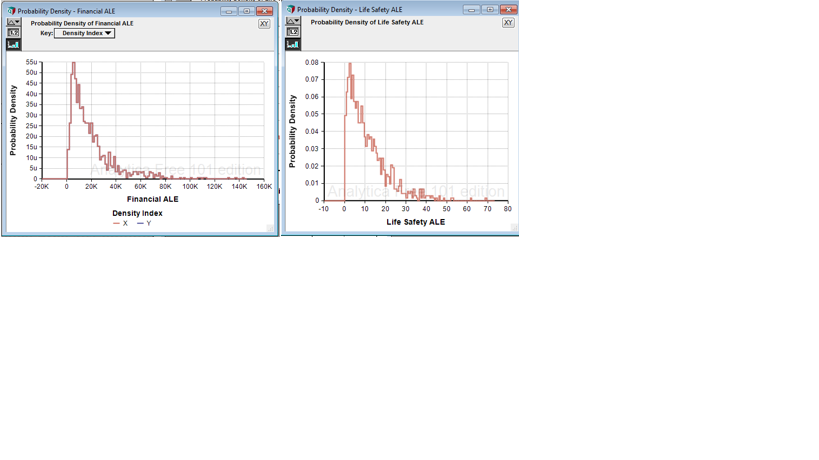
Figures 2a and 2b. Financial and Life Safety ALE
The decision maker has one budget to allocate to mitigate
both risks, so a very pressing question is whether, and to what degree,
mitigating one also mitigates the other.
Do they vary together or opposite to each other? The next chart is a scatter plot of the
simulation results. Each dot is one MC
trial.

Figure 3. Scatterplot of Financial and Life Safety
ALEs. Each dot is a simulation trial.
Not surprisingly, financial loss
and life safety are highly correlated.
This makes intuitive sense since each life lost imposes a risk of
lawsuits and settlement costs on the railroad.
However the degree of correlation becomes weaker at higher levels of
loss. If there is any good news for the
railroad, it is that spending money to reduce financial loss also tends to
reduce life safety loss.
The Counterfactual Scenario
The reason that financial ALE and
life safety ALE are so strongly correlated is the high value I put on a lost
life (PERT with minimum, most likely, and maximum of $500K, $1000K, $5000K per
life). To test how strongly life safety
loss drives financial loss, I constructed a counterfactual model which puts the
financial loss of a lost life at zero.
In this structure the connection from Secondary Financial Loss Magnitude
to Financial ALE was simply removed.

Figure 4. Counterfactual Model. The railroad has no liability for lives lost.
The correlation between the two
impact variables now looks like this:

Figure 5. Scatterplot of Financial and Life Safety ALEs
when the railroad has no liability for lives lost.
The correlation is still positive
because the worse the accident, the more lives lost and the more equipment
destroyed, but looser.
Conclusions
1. FAIR can be used, quite straightforwardly, to
analyze the risk of scenarios that have multiple impact variables. What needs to be added is some analysis of
how the various loss expectancies relate to each other. Tradeoffs among ALEs of multiple impact
variables is left to the decision maker, or to another analysis.
2.
Making the railroad (or in general the provider)
liable for non-financial losses imposed on secondary stakeholders tends to
align multiple risk measures in the decision making of the provider. The greater the liability to the provider,
the better the alignment. This is
obvious but the model illuminates the degree to which, and the manner in which,
the alignment is created
3.
Therefore modeling of this sort can be useful
for public policy analysis. It could be
used to explore different kinds of transfer of liability from secondary
stakeholders to the primary stakeholder, and different levels of absolute
liability (e.g. should there be limits on the valuation of a life, and what
might they be?)
4.
This kind of multi-impact risk analysis can be
useful in many kinds of public policy analysis involving risk other than
transportation safety, such as health care, pollution, water allocation, earthquake
and extreme storm hazard mitigation, and defense planning.
Steve,
ReplyDeleteGreat work; thank you. I'm currently working to introduce FAIR to my org and am always looking for ways to extend its reach. I'm also currently exploring Analytica (Free 101 for now) as a potential tool for the toolbox. Would you be willing to share your Analytica file? I'd love to use it as a learning tool and jumping off point. joel(dot)baese(at)yahoo(dot)com